Journal Metrics
Journal metrics provide one way to compare and evaluate the quality of journals in order to identify suitable journals to publish in, as well as support grant and promotion applications. Journal metrics are published yearly based on the average amount of citations received by all articles within a journal in proceeding years. This provides an indication of the overall citation performance of the journal.
The availability of specific journal metrics will depend on where the journal is indexed. Most journal metrics are calculated for journals that are indexed in either Scopus or specific indices within Web of Science. Some metrics will only apply to Scopus-indexed journals, and some will only apply to Web of Science-indexed journals.
In Australia, you might also want to consider if the journal appears on the Excellence in Research for Australia (ERA) Journal List. You can check if a journal is on the ERA Journal List by searching in Journal Finder. Journal Finder is a tool to help Western Sydney University researchers compare and evaluate relevant journals in their field and contains only those journals on the current ERA Journal list (approx. 25,000 journals).
Considerations
- The overall citation performance of a journal does not indicate the quality or performance of individual articles published within that journal.
- Metrics and rankings may vary between sources due to differences in how they are calculated (methodology) and which journals are indexed (coverage).
- Different disciplines accrue citations at different paces and quantities.
- Not every journal will have metrics available. For example, if it is not indexed by Scopus or Web of Science.
Types of Journal Metrics
Quartile Rankings
Q1, Q2, Q3, Q4 Journals
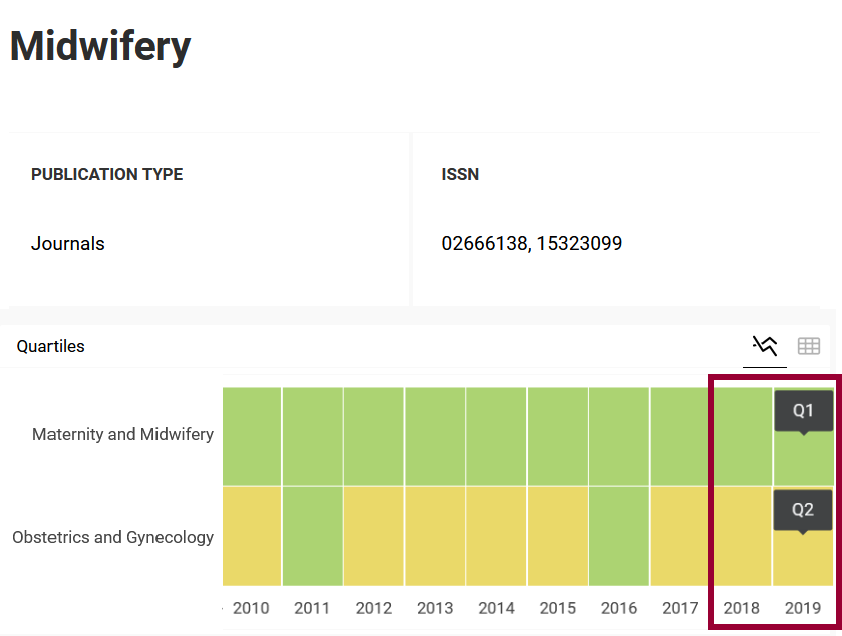
There are two different quartile metrics depending on where the journal is indexed.
- SCImago Journal & Country Rank (SJR) quartiles: journals from Scopus are ranked according to weighted citations – worth more or less depending on the source they come from. The subject field, quality and reputation of the journal have a direct effect on the value of a citation.
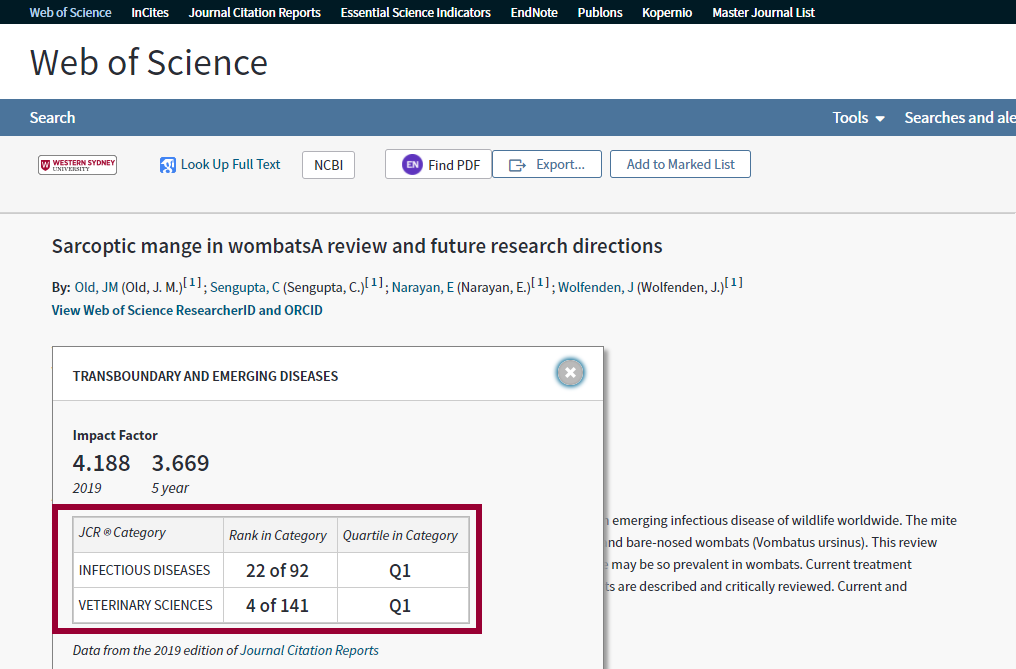
- Journal Citation Reports (JCR) quartiles: journals from certain Web of Science indices are ranked according to their Journal Impact Factor.
In either case, journals are grouped into subject categories and ranked according to the methodology described above.
Ranked lists are divided into quartiles. Journals which appear in the first quartile of a list (Q1) represent the top 25% of journals in that subject. Rankings can be used as an indicator of how prestigious the journal is.
| Quartile Rank - Q1, Q2, Q3, Q4 | Position Rank - 2/256, 64/89 |
|---|---|
| Journals are grouped into subject category and ranked according to the Journal Impact Factor (JCR) or citation weighting (SJR). Top ranked journals are in Q1. Journals may be included in more than one subject category, so check that the ranking applies to the subject category that is relevant to you. | This shows the journal’s positional rank within a subject area e.g. 2/256 means that the journal is ranked 2nd out of 256 journals in that subject area. Positions are ordered by Journal Impact Factor (JCR) or citation weighting (SJR). |
SJR (SCImago) quartiles and rankings can be found in SCImago:

JCR quartiles and rankings can be found in Web of Science (and also on the JCR website):

Considerations
- Remember that InCites only analyses data from Web of Science-indexed content; SciVal only analyses data within Scopus-indexed content. Only journals which are indexed by Scopus or Web of Science will appear in ranking lists.
- Any caveats that apply to the Journal Impact Factor and citation weighting methodologies, also apply to the quartile rankings.
Journal Impact Factor (JCR)
The Journal Impact Factor (JIF) is a Clarivate metric that measures of the number of citations which the ‘average article’ in a journal indexed in Web of Science has received in a particular year, calculated within a 2 year window. There is also a 5 Year JIF which measures average citations within a 5 year window.
The 2020 Impact Factors (released in 2021) used the following calculation:
Number of citations received in 2020 from all items published in Journal X during 2018 and 2019
_________________________________________________________________________________Number of articles and reviews published in Journal X in 2018 and 2019
For example, a JIF of 4.1 means that, on average, articles published in that journal in 2017 or 2018 have been cited 4.1 times.
Generally, journals with a higher JIF are seen to have greater impact / influence within their discipline as they are being cited more often than those with a relatively lower JIF.
(NB: Elsevier's version of this metric is called CiteScore, see next section)
Considerations
- Remember that InCites only analyses data from Web of Science-indexed content; SciVal only analyses data within Scopus-indexed content. Only journals indexed in Web of Science will have a JIF.
- Can only be used to compare journals within the same discipline.
- A few very highly cited articles within the journal can skew the average, to give a misleading indication of citation potential.
CiteScore (Scopus)
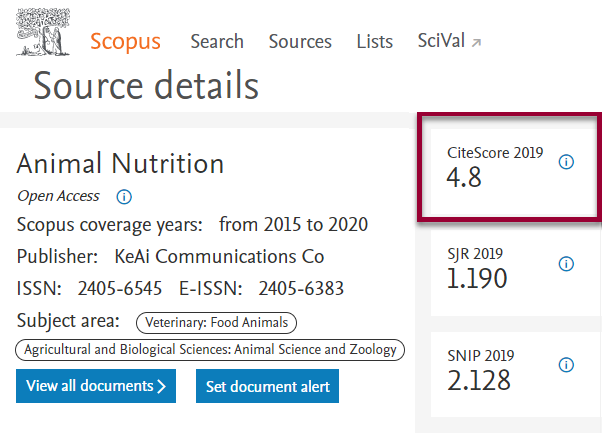
CiteScore is an Elsevier metric that measures the average number of citations per publication the journal receives within a 4 year window. It is a comparable metric to the Journal Impact Factor but instead analyses journals indexed in the Scopus database and uses a slightly different methodology.
The 2020 CiteScore used the following calculation:
Number of citations to peer reviewed publications published in Journal X during 2017-2020
_________________________________________________________________________________Number of peer reviewed publications published in Journal X in 2017-2020
CiteScore only includes peer-reviewed publication types in the calculation: articles, reviews, conference papers, book chapters and data papers.
For example, a CiteScore of 4.8 means that, on average, peer-reviewed publication types published in 2016-2019 have been cited 4.8 times.

Generally, journals with a higher CiteScore are seen to have greater impact / influence within their discipline as they are being cited more often than those with a relatively lower CiteScore.
Considerations
- Remember that InCites only analyses data from Web of Science-indexed content; SciVal only analyses data within Scopus-indexed content. Only journals indexed in Scopus will have a CiteScore.
- Can only be used to compare journals within the same discipline.
- A few very highly cited articles within the journal can skew the average, to give a misleading indication of citation potential.
SNIP (Scopus)
Source Normalized Impact per Paper
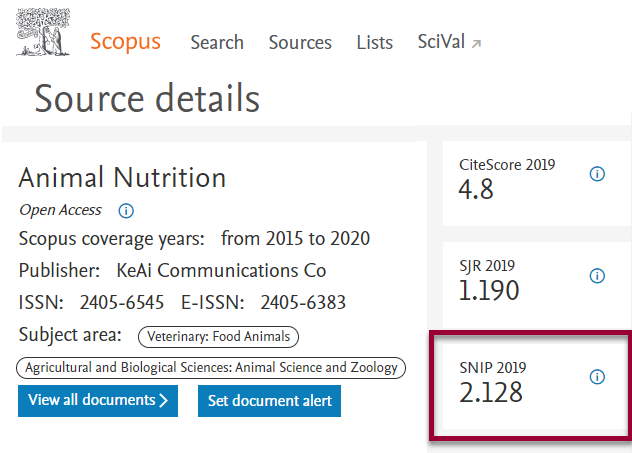
Unlike the Journal Impact Factor and CiteScore, Source Normalized Impact per Paper (SNIP) is a field normalised measure of journal impact. That means it measures the citation impact of a journal within the context of its discipline, and weights it accordingly. This is important because it accounts for the fact that different disciplines accrue citations at different paces and quantities, and allows you to compare journals from different disciplines.
SNIP compares a journal’s average citations per publication with the citation potential in its field.
A journal with a SNIP value of 1.0 indicates it has the median number of citations for journals in that field; anything above 1 indicates above average citation potential.
Considerations
- Only journals indexed in Scopus will have a SNIP, as this is an Elsevier metric.